Cohort Analysis
Cohort Analysis - by user visit
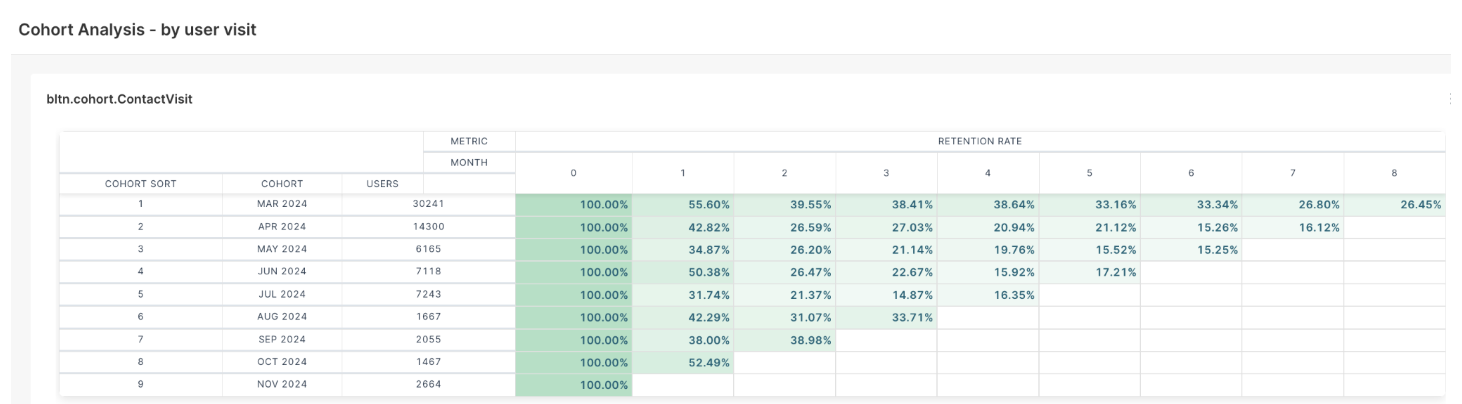
This report helps analyze how different groups of users (cohorts) engage with a system after their initial visit. The retention rate is displayed across multiple months to understand user engagement trends.
Cohort Analysis - by user visit
Understanding the Report
- Cohort: A group of users who performed their first visit in the same month.
- Users: The number of users in each cohort.
- Retention Rate: The percentage of users returning in the following months after their initial visit (Month 0 represents the starting point).
How to Read the Table:
- Each row represents a cohort, grouped by the first month users visited the platform.
- The first column shows the cohort month and year.
- The second column lists the number of users in each cohort.
- The columns labeled "0, 1, 2, 3,..." represent the months after the initial visit.
- The percentages indicate the retention rate, showing how many users returned in each subsequent month.
Cohort Analysis - by device visit
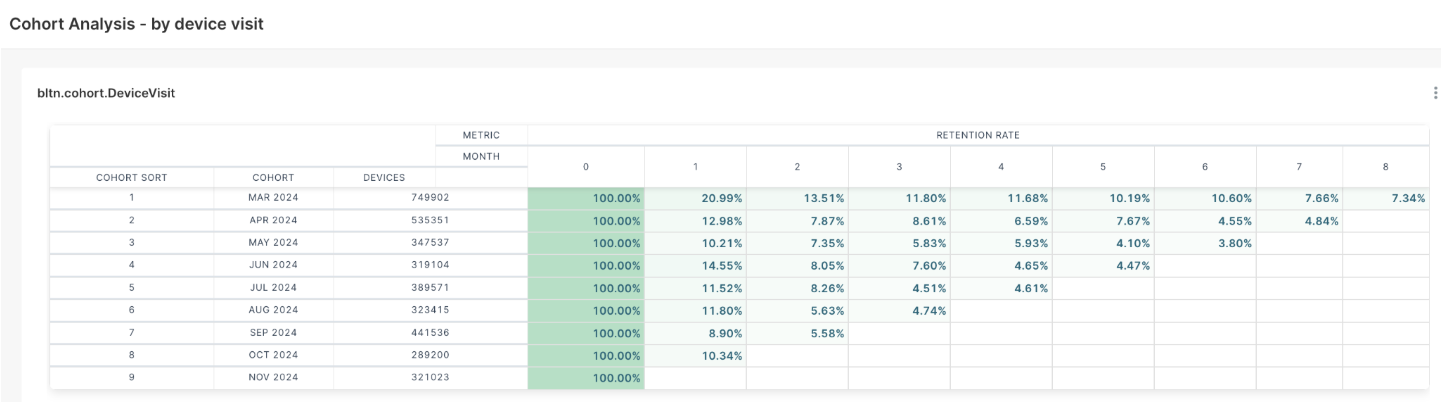
This report helps analyze how different groups of devices (cohorts) engage with a system after their initial visit. The retention rate is displayed across multiple months to understand device engagement trends.
Cohort Analysis - by device visit
Understanding the Report
- Cohort: A group of devices that accessed the system for the first time in the same month.
- Devices: The number of unique devices in each cohort.
- Retention Rate: The percentage of devices returning in the following months after their initial visit (Month 0 represents the starting point).
How to Read the Table
- Each row represents a cohort, grouped by the first month the devices visited the platform.
- The first column shows the cohort month and year, indicating when the devices were first detected.
- The second column lists the number of devices in each cohort.
- The columns labeled "0, 1, 2, 3,..." represent the months after the initial visit.
- The percentages indicate the retention rate, showing how many devices returned in each subsequent month.
Related Articles
RFM Analysis
The Analysis module aims to help businesses understand customer behavior, identify high-value segments, and optimize engagement strategies. By leveraging RFM (Recency, Frequency, and Monetary) scoring, the module enables data-driven decision-making, ...RFM Analysis
Analysis RFM Segments In the first tab of the “Analysis” screen, you’ll find the RFM Segments chart, which visually maps customer segments based on their Recency and Frequency scores. The vertical axis represents the frequency score, while the ...Mixpanel
Mixpanel is a leader in the product analytics space, that provides real-time insights into app/website interactions and leverages brands to devise effective marketing strategies according to their customer behavior. D·engage provides an ...Revenue Mapping
The Revenue Mapping feature is essential for tracking and reporting the revenue generated by your campaigns. By configuring this feature, you ensure precise financial analysis and maximize the impact of your advertising efforts. Revenue Mapping ...Event Logs
The Event Logs feature provides detailed insights into campaign activities, ensuring transparency and enabling in-depth analysis of performance and system actions. The Event Logs screen displays key details about recorded events: Name: The name of ...